


1. Introduction
It is generally understood COP falls off with increasing temperature difference; hence it follows the COP when producing hot water is expected to be lower than that for space heating. However, the COP quoted in sales literature is often that measured for space heating performance and few, if any, studies have made a direct comparison of the COP when heating domestic hot water only.
Comparing like-for like performance requires a standard test method. EN13203 tapping cycle no. 2, reflects typical DHW energy use of 5.845 kWh/ day, around 120 litres, in line with the SAP predicted consumption for a 3 bedroom property. This article summarises the test results for a number of water heating technologies, enabling some comparisons to be made.
2. Test method
2.1. Decerna tapping cycle tests
Decerna conducted tap cycle no. 2 tests on the following technologies:
Ongoing trial of a packaged thermodynamic solar water heater with public results
- Ongoing trial of a thermodynamic solar system with heat exchange to a high performance cylinder
- 2m2 conventional solar thermal system, with 300 litre total storage and immersion-only back up
- One month trial of MCS installed ASHP with 210 litre cylinder in the training centre
2.2.Tap cycle control
To ensure straightforward comparative testing, the test rig subjects each DHW unit to EN13203-2, tapping cycle no.2. The same tap cycle is also used in EN16147:2011, known as tapping cycle M.
The tapping cycle has 23 draw-offs during the day, from 07:00 through to 21:30. Each draw-off starts at a fixed time of day (as Table 1), and ends when the appropriate quantity of hot water heat energy has been delivered. Hence, fixed quantities of energy are drawn-off, not specific volumes of water (e.g. if the water temperature is cooler, the valve is open longer until the required heat is measured). The total daily draw is 5,845Wh per day.
2.3. Test rig Instrumentation
| Quantity | Measuring device |
| Electricity | Elster A100C tariff grade electricity meter |
| Temperature | Fine tip PT100 immersed in fluid pipe for heat calculation & control |
| Solar irradiance | Kipp and Zonen SP-lite pyranometer in plane with collector |
| Water consumption | Titan OG4 |
| Heat Energy of DHW | Calculated from temp and flow (mcdT) by controller in real time |
| Heat output of heat pump | Sontex Supercal 531 with 440 flowmeter (RHI & MID compliant) |
3. Results
Results are presented for:
- Thermodynamic panel, from February to August, in lab
- Conventional solar water heater with immersion back up, for June to September, in lab
- ASHP unvented cylinder system for part August and September, in training centre
The COP values in the tables include the tank heat loss as part of the hot water load in order to give a realistic comparison with what would be achieved in service, whereby the system would have to produce energy to overcome the tank losses.
3.1 Thermodynamic panel
The thermodynamic system is a single panel, 210 litre unit with compressor and ancillary equipment housed in the top of the tank casing. The unit was fitted with a timeswitch to ensure it only operated between 6:30 and 21:00 hrs. In general, the unit would heat the cylinder and switch off on its thermostat by around 3 or 4pm, the setpoint being 55°C. Table 2 shows the monthly average data for the unit.
| Month | External ambient temperature °C | In-plane solar irradiance Wh | Electricity consumption(Ehp) | Coefficient of Performance COP (COPhp) |
| January | 7.0 | 307 | 5735 | 1.43 |
| February | 8.7 | 1789 | 5514 | 1.50 |
| March | 10.1 | 2743 | 4491 | 1.87 |
| April | 12.2 | 2206 | 4258 | 1.91 |
| May | 15.0 | 2733 | 3839 | 2.10 |
| June | 17.9 | 2667 | 3655 | 2.19 |
| July | 18.8 | 2758 | 3784 | 2.23 |
| August | 16.3 | 2689 | 3603 | 2.27 |
The data presented online (https://www.decerna.co.uk/thermodynamic-panel-data/) shows the total daily COP and irradiance plotted as a bar chart. Fig. 1 shows the results for June.
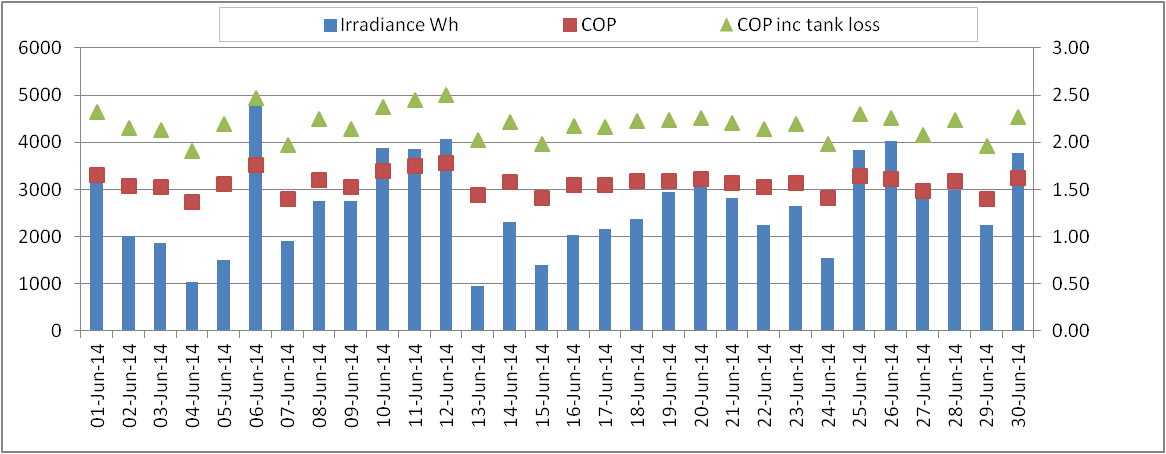
The COP (including the tank loses) is very close to 2.5 on several occasions, surpassing that required to qualify as renewable under the European Commission Renewable Energy Directive. On 12th June it is 2.50.
3.2. Conventional solar thermal
Two flat plate collectors are mounted on the building roof at 30° tilt angle, with total aperture area of 4.2m2 feeding a storage volume of 300 litres comprising 150 litres dedicated solar volume, 150 litre with back up via a immersion heater timed for 5pm to 8pm, setpoint 55°C. The solar controller was set similar to industry good practice settings of 65 maximum tank temperature, dT on of 6° and dT off of 4°C. The test commenced on June 6th, with solar contribution from June 10th (due to a sensor fault).
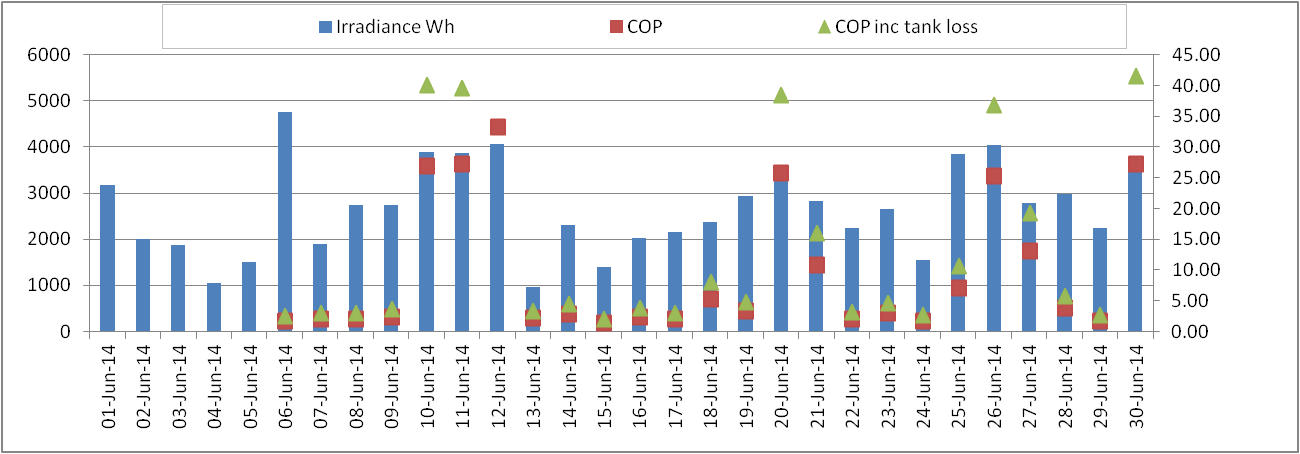
Fig.2 shows the results for June.
The daily variation is strongly related to the solar irradiance, with a peak COP of 48 achieved on June 12th when total in-plane irradiance was 6550 Wh/m2. Conversely, it falls to 1.98 on 15th June when solar irradiance was only 2735 Wh/m2. As the test did not commence until June 6th, data is not available for earlier months. The monthly averages are presented in Table 3.
| Month | External ambient temperature °C | In-plane solar irradiance Wh | Electricity consumption | Coefficient of Performance COP |
| June | 17.9 | 4741 | 1801 | 13.0 |
| July | 18.8 | 4449 | 3861 | 8.0 |
| August | 16.3 | 4068 | 2787 | 5.0 |
| September | 15.8 | 2890 | 4085 | 2.38 |
Table 3; performance test data for solar thermal + immersion unit
3.3 Air source heat pump and 250 litre cylinder
The Decerna training centre has heating and hot water provided by a Mitsubishi EcoDan 8.5kW air source heat pump fitted by MCS contractors along with an OSO 250 litre twin coil mains pressure cylinder. The cylinder also has solar thermal, but to ensure this test was air-source only, the solar circuit was drained and valved off. The building space heating remained switched off throughout the test to ensure all electricity consumed is for DHW preparation only.
A duplicate control system ensures the same tapping cycle is drawn as per the other tests in the Brunel building. Limited results are available; from 21st to 26th August and from 8th September onwards due to staff holidays. The September data is presented in Fig. 3.
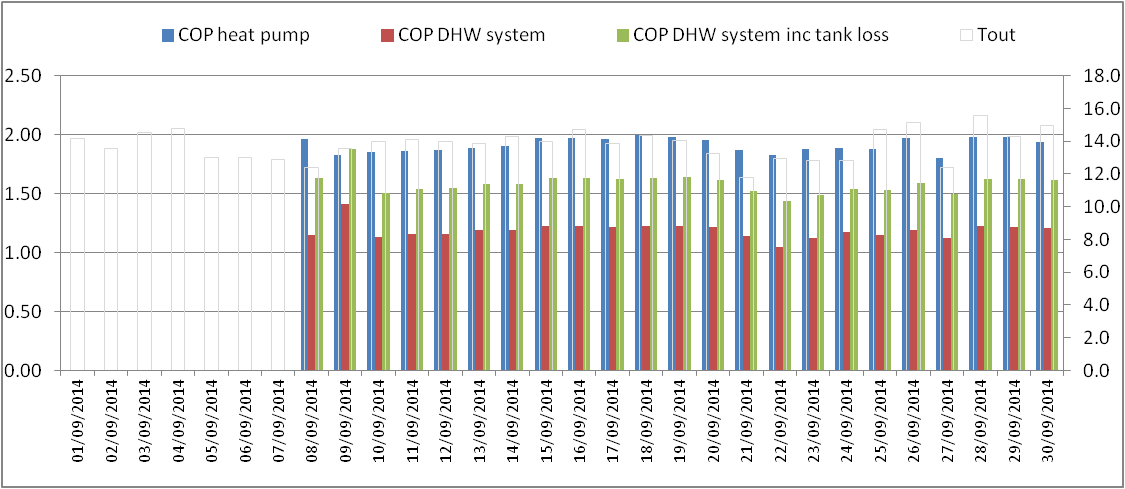
Fig.3 shows the available data for September. Daily COP for the DHW system including tank loss is reasonably consistent within the range 1.44 to 1.88, with average for the month of 1.59.
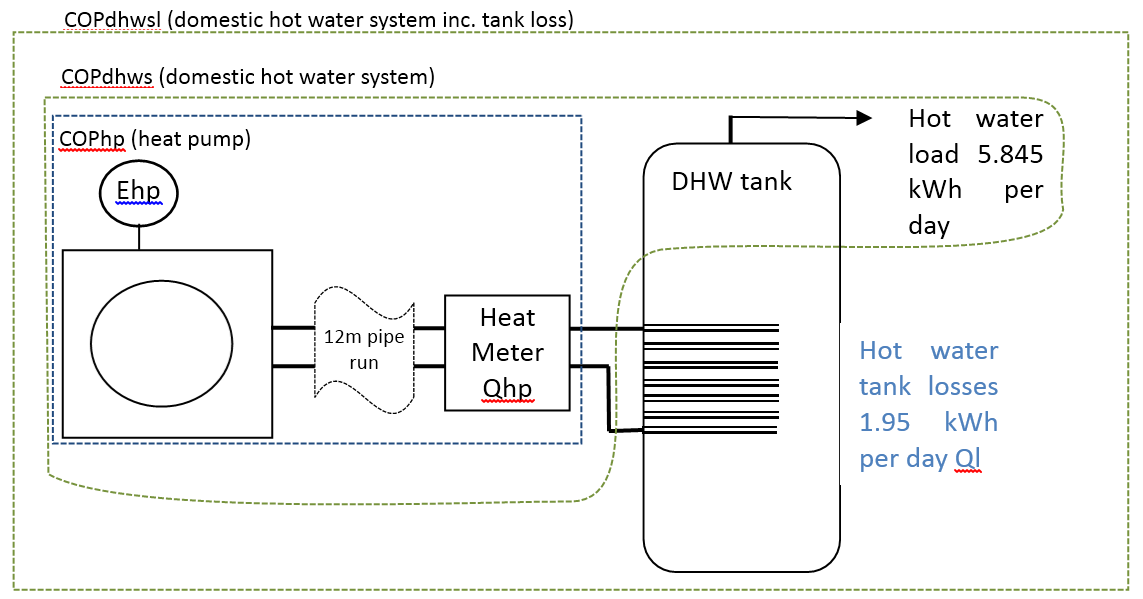
The COP is shown in Fig.3 in three ways:
- COP heat pump is the ratio of heat energy delivered to tank (measured by the heat meter) divided by the electricity consumed and is the closest comparison to the heat pump lab test EN 14511:2011, (albeit at the higher flow temperature than that usually reported at A7W35)
- COP domestic hot water system is the daily total domestic hot water energy draw off (5845Wh) divided by the total electricity consumed by the heat pump in that day. Hence, it takes no account of tank losses.
- COP domestic hot water system inc tank loss includes the tank losses as part of the hot water load on the system, as per the thermodynamic test. The standing loss is that declared by the manufacturer at 1.95 kWh/day (http://www.osohotwater.co.uk/domestic-products/solarcyl-twin-coil.html)
The COPs are represented in Fig 4. COPdhwsl includes tank losses and can be compared with the other two technologies.
4. Conclusions
Decerna tested three hot water heating technologies using EN13203 tapping cycle no. 2, a standard load profile to compare energy efficiency of different water heaters. Tapping cycle no.2 provides a typical DHW energy use of 5.845 kWh/ day, around 120 litres, in line with the SAP method predicted consumption for a 3 bedroom property.
The water heaters tested were:
- a packaged solar thermodynamic unit
- a conventional solar thermal system with immersion back up
- a conventional cylinder heated by an MCS compliant air source heat pump
Monthly average COP values are presented based on the monitored data. The COP is calculated as the ratio of hot water load + tank losses divided by the electricity consumed in each 24hr period within the month.
The results show a range of COP values for the thermodynamic system, from 1.43 in January to 2.27 in August. The daily value exceeds 2.5 on several occasions, surpassing that required to qualify as renewable under the European Commission Renewable Energy Directive. It appears the COP varies more with ambient temperature than the daily solar gain.
The conventional solar thermal system COP is strongly related to the solar irradiance, with a peak COP of 48 achieved on June 12th when total in-plane irradiance was 6550 Wh/m2. Conversely, it falls to 1.98 on 15th June when solar irradiance was only 2735 Wh/m2. The monthly average is 13.0 for June, falling to 2.38 for September.
The ASHP system daily COP for the month of September is reasonably consistent within the range 1.44 to 1.88, with average for the month of 1.59; due to the standing losses from the system when considered as a hot water only package (as would typically be the case in summer).
As with any monitoring trial, a longer monitoring period would enable greater confidence in the conclusions drawn, but the results do show the difference between technologies when considered as units solely for the production of domestic hot water.
Appendix: Seasonal Performance Factor SPF
Ofgem definition: (from https://www.ofgem.gov.uk/key-term-explained/seasonal-performance-factor-spf)
- SPF is a measure of the operating performance of an electric heat pump heating system over a year. It is the ratio of the heat delivered to the total electrical energy supplied over the year.
- SPF = Total heat energy output per annum (kWh) ÷ Total input electricity per annum (kWh)
- For example, a heat pump with an SPF of 2.5 will on average deliver 2.5kWh of heat for every 1kWh of electricity it uses.
The SEPEMO report (http://ec.europa.eu/energy/intelligent/projects/sites/iee-projects/files/projects/documents/sepemo-build_final_report_sepemo_build_en.pdf) describes SPF as evaluation of field measurement data according to the defined system boundaries, and notes (p.17): There are different existing standards and regulations for calculating the SPF. These calculation methodologies are mainly based on input from the testing standard EN 14511. The system boundaries of testing standards are however focused on the heating or cooling unit itself. In comparing test results, the system integration is not taken into account. Therefore these standards do not include the entire energy consumption of the auxiliary drives on the heat sink and heat source side.
Four SPF methodologies are used in SEPEMO, which include an increasing amount of auxiliary devices in the system e.g. circulator pumps, air source fans etc.
SPFH1 contains only the heat pump unit and evaluates the performance of the refrigeration cycle. The system boundaries are similar to COP defined in EN 14511. It is therefore effectively a lab test, but may exclude the energy consumption of any air fan or ground pump.
SPFH2 contains the heat pump unit and the equipment to make the source energy available (e.g. ground pump, air fan) for the heat pump. SPFH2 evaluates the performance of the HP operation, and this level of system boundary responds to SCOPNET in prEN 14825 and the RES-Directive requirements. It is therefore effectively a lab test, but includes the energy consumption of any air fan or ground pump.
SPFH3 contains the heat pump unit, the equipment to make the source energy available (e.g. ground pump, air fan) and the back up heater. SPFH3 represents the heat pump system and thereby it can be used for comparison to conventional heating systems (e.g. oil, gas boilers etc). The back-up heater consumption to ‘make-up’ temperature for high load conditions e.g winter and DHW production may have a critical impact on the SPF, especially in a poorly designed or operated system where electric boost heating is often used.
SPFH4 contains the heat pump unit, the equipment to make the source energy available, the back up heater and all auxiliary drives including the auxiliary of the heat sink system. SPFH4 represents the heat pump heating system including all auxiliary drives which are installed in the heating system. It is therefore similar to SPFH3 but with the addition of pump energy in the heat distribution system.
All the above SPFs are aimed at reporting performance of systems predominantly for space heating. Although hot water service can also be measured using SPFH3 and SPFH4, in order to compare hot water performance of different water heaters the product COP should be determined using tapping cycles to give fair comparison, as the tank losses need to be included.
EN16147:2011 provides a test method to achieve this and determine the COPdhw – defined as ‘coefficient of performance which is determined by the use of EU reference tapping cycles and which includes the heat losses of the storage tank’
>>>Download the pdf of the COP of water heating technologies report here<<<